2019 UK local government election
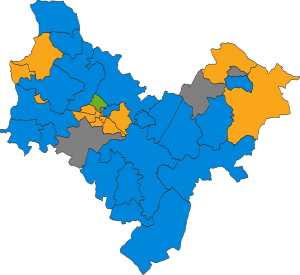
The 2019 Stratford-on-Avon District Council election took place on 2 May 2019 to elect members of the Stratford-on-Avon District Council in England.[1] It was held on the same day as other local elections.
Summary
Election result
| 2019 Stratford-on-Avon District Council election |
| Party | Candidates | Seats | Gains | Losses | Net gain/loss | Seats % | Votes % | Votes | +/− |
| | Conservative | 35 | 20 | 0 | 11 |  11 11 | 55.6 | 45.8 | 17,047 | –8.1 |
| | Liberal Democrats | 35 | 11 | 8 | 0 |  8 8 | 30.6 | 28.7 | 10,669 | +9.3 |
| | Independent | 4 | 4 | 3 | 0 | 3 | 11.1 | 6.0 | 2,232 | +4.4 |
| | Green | 36 | 1 | 1 | 0 | 1 | 2.8 | 12.0 | 4,446 | +7.5 |
| | Labour | 31 | 0 | 0 | 1 | 1 | 0.0 | 7.3 | 2,725 | –5.7 |
| | UKIP | 1 | 0 | 0 | 0 |  | 0.0 | 0.2 | 70 | –5.7 |
Ward results
Alcester & Rural
Alcester & Rural | Party | Candidate | Votes | % | ±% |
| | Conservative | Mark Cargill | 712 | 58.0 | -12.6 |
| | Labour | Andrew Foster | 211 | 17.2 | +7.2 |
| | Liberal Democrats | Carolyn Evans | 197 | 16.1 | -3.2 |
| | Green | Michael Mordue | 107 | 8.7 | New |
| Majority | | | |
| Turnout | 1,251 | 42.7 | |
| | Conservative hold | Swing | | |
Alcester Town
Alcester Town | Party | Candidate | Votes | % | ±% |
| | Liberal Democrats | Susan Juned | 482 | 47.6 | +18.2 |
| | Conservative | Susan Adams | 404 | 39.9 | -14.5 |
| | Labour | Emma Randle | 70 | 6.9 | -4.5 |
| | Green | Jacob Hotson | 57 | 5.6 | +0.8 |
| Majority | | | |
| Turnout | 1,030 | 34.7 | |
| | Liberal Democrats gain from Conservative | Swing | | |
Avenue
Avenue | Party | Candidate | Votes | % | ±% |
| | Green | Jon Riley | 279 | 41.4 | +32.8 |
| | Liberal Democrats | Cohl Warren-Howles | 170 | 25.2 | +10.2 |
| | Conservative | Juliet Short | 166 | 24.6 | -18.3 |
| | Labour | Karen Brown | 59 | 8.8 | -7.7 |
| Majority | | | |
| Turnout | 680 | 27.8 | |
| | Green gain from Conservative | Swing | | |
Bidford East
Bidford East | Party | Candidate | Votes | % | ±% |
| | Conservative | Darren Pemberton | 516 | 51.4 | -2.9 |
| | Labour | Anthony Kent | 212 | 21.1 | +1.1 |
| | Liberal Democrats | Manuela Perteghella | 170 | 16.9 | +8.2 |
| | Green | Thomas Venus | 106 | 10.6 | New |
| Majority | | | |
| Turnout | 1,024 | 33.3 | |
| | Conservative hold | Swing | | |
Bidford West & Salford
Bidford West & Salford | Party | Candidate | Votes | % | ±% |
| | Conservative | William Fleming | 529 | 57.1 | -2.7 |
| | Green | Thomas Genders | 167 | 18.0 | New |
| | Liberal Democrats | William Horton | 140 | 15.1 | New |
| | Labour | Christopher Jury | 90 | 9.7 | -11.7 |
| Majority | | | |
| Turnout | 940 | 32.2 | |
| | Conservative hold | Swing | | |
Bishop Itchington
Bishop Itchington | Party | Candidate | Votes | % | ±% |
| | Conservative | Christopher Kettle | 644 | 63.5 | -3.6 |
| | Liberal Democrats | Fiona Larner Onslow-Free | 214 | 21.1 | +12.3 |
| | Green | Matthew North | 156 | 15.4 | +5.6 |
| Majority | | | |
| Turnout | 1,033 | 33.7 | |
| | Conservative hold | Swing | | |
Bishopton
Bishopton | Party | Candidate | Votes | % | ±% |
| | Liberal Democrats | Victoria Alcock | 443 | 56.8 | +16.6 |
| | Conservative | Roger Brian | 209 | 26.8 | -15.3 |
| | Green | Bruno Mason | 70 | 9.0 | +0.9 |
| | Labour | Aaron Marshall | 58 | 7.4 | -0.7 |
| Majority | | | |
| Turnout | 796 | 31.5 | |
| | Liberal Democrats gain from Conservative | Swing | | |
Brailes & Compton
Brailes & Compton | Party | Candidate | Votes | % | ±% |
| | Conservative | Sarah Whalley-Hoggins | 691 | 60.3 | -11.6 |
| | Liberal Democrats | Sara Billins | 251 | 21.9 | +7.9 |
| | Green | Anne Waldon | 135 | 11.8 | New |
| | Labour | Ronan Woods | 69 | 6.0 | -8.1 |
| Majority | | | |
| Turnout | 1,172 | 42.5 | |
| | Conservative hold | Swing | | |
Bridgetown
Bridgetown | Party | Candidate | Votes | % | ±% |
| | Liberal Democrats | Ian Fradgley | 596 | 47.2 | +9.5 |
| | Conservative | Lynda Organ | 464 | 36.7 | -9.4 |
| | Green | Stephen Ward | 115 | 9.1 | +2.0 |
| | Labour | Robin Malloy | 89 | 7.0 | -2.1 |
| Majority | | | |
| Turnout | 1,283 | 40.7 | |
| | Liberal Democrats gain from Conservative | Swing | | |
Clopton
Clopton | Party | Candidate | Votes | % | ±% |
| | Independent | Jason Fojtik | 404 | 56.5 | New |
| | Liberal Democrats | Philip How | 180 | 25.2 | +4.3 |
| | Conservative | Ryan Podmore | 92 | 12.9 | -13.5 |
| | Green | Elliot Wassell | 39 | 5.5 | +0.2 |
| Majority | | | |
| Turnout | 727 | 39.0 | |
| | Independent gain from Labour | Swing | | |
Ettington
Ettington | Party | Candidate | Votes | % | ±% |
| | Conservative | Penny-Anne O'Donnell | 782 | 67.0 | +1.7 |
| | Liberal Democrats | Nina Knapman | 171 | 14.6 | +3.2 |
| | Green | Angela Webb | 158 | 13.5 | +8.2 |
| | Labour | Alexander Monk | 57 | 4.9 | -3.5 |
| Majority | | | |
| Turnout | 1,185 | 42.7 | |
| | Conservative hold | Swing | | |
Guildhall
Guildhall | Party | Candidate | Votes | % | ±% |
| | Liberal Democrats | Jennifer Fradgley | 710 | 63.9 | +25.5 |
| | Conservative | Karen Parnell | 225 | 20.3 | -13.2 |
| | Green | Stephen Micaux | 105 | 9.5 | +1.6 |
| | Labour | Neil Annat | 71 | 6.4 | -3.6 |
| Majority | | | |
| Turnout | 1,132 | 44.2 | |
| | Liberal Democrats hold | Swing | | |
Harbury
Harbury | Party | Candidate | Votes | % | ±% |
| | Independent | Jacqueline Harris | 451 | 40.7 | New |
| | Liberal Democrats | Suzannah Bushill | 418 | 37.7 | +2.6 |
| | Green | David Watkin | 133 | 12.0 | +4.6 |
| | Labour | Thomas Greenway | 107 | 9.6 | -0.8 |
| Majority | | | |
| Turnout | 1,132 | 39.7 | |
| | Independent gain from Conservative | Swing | | |
Hathaway
Hathaway | Party | Candidate | Votes | % | ±% |
| | Liberal Democrats | Gillian Cleeve | 304 | 46.3 | +9.7 |
| | Conservative | Timothy Sinclair | 146 | 22.2 | -13.9 |
| | Labour | Kieran Kelly | 111 | 16.9 | +1.0 |
| | Green | Peter Pettifor | 96 | 14.6 | +3.3 |
| Majority | | | |
| Turnout | 668 | 29.6 | |
| | Liberal Democrats hold | Swing | | |
Henley-in-Arden
Henley-in-Arden | Party | Candidate | Votes | % | ±% |
| | Conservative | Matthew Jennings | 805 | 65.2 | -5.1 |
| | Green | Penelope Stott | 241 | 19.5 | +10.3 |
| | Liberal Democrats | Karyl Rees | 107 | 8.7 | +0.2 |
| | Labour | Christopher Jones | 81 | 6.6 | -5.3 |
| Majority | | | |
| Turnout | 1,257 | 40.2 | |
| | Conservative hold | Swing | | |
Kineton
Kineton | Party | Candidate | Votes | % | ±% |
| | Conservative | Christopher Mills | 824 | 66.8 | +5.0 |
| | Liberal Democrats | Nicholas Solman | 210 | 17.0 | +8.1 |
| | Green | Robert Ballantyne | 199 | 16.1 | +9.3 |
| Majority | | | |
| Turnout | 1,249 | 42.7 | |
| | Conservative hold | Swing | | |
Kinwarton
Kinwarton | Party | Candidate | Votes | % | ±% |
| | Conservative | Gillian Forman | 520 | 54.1 | -13.5 |
| | Liberal Democrats | Lynn Bowring | 302 | 31.4 | +7.5 |
| | Green | Therese Venus | 82 | 8.5 | New |
| | Labour | Kathrin Foster | 57 | 5.9 | -2.6 |
| Majority | | | |
| Turnout | 972 | 42.2 | |
| | Conservative hold | Swing | | |
Long Itchington & Stockton
Long Itchington & Stockton | Party | Candidate | Votes | % | ±% |
| | Liberal Democrats | Louis Adam | 491 | 46.2 | +33.2 |
| | Conservative | Ben Dalton | 355 | 33.4 | -34.3 |
| | Labour | James Briggs | 123 | 11.6 | -7.7 |
| | Green | Elizabeth Donovan | 93 | 8.8 | New |
| Majority | | | |
| Turnout | 1,090 | 32.7 | |
| | Liberal Democrats gain from Conservative | Swing | | |
Napton & Fenny Compton
Napton & Fenny Compton | Party | Candidate | Votes | % | ±% |
| | Liberal Democrats | Nigel Rock | 539 | 50.8 | +36.6 |
| | Conservative | Emilia Fletcher | 394 | 37.2 | -19.7 |
| | Green | Zoe James | 127 | 12.0 | New |
| Majority | | | |
| Turnout | 1,079 | 40.9 | |
| | Liberal Democrats gain from Conservative | Swing | | |
Quinton
Quinton | Party | Candidate | Votes | % | ±% |
| | Conservative | Edward Fitter | 515 | 59.1 | -7.8 |
| | Green | Olivia Hatch | 180 | 20.6 | New |
| | Liberal Democrats | Diane Walden | 107 | 12.3 | +2.0 |
| | Labour | Nicholas Partington | 70 | 8.0 | -1.4 |
| Majority | | | |
| Turnout | 891 | 33.0 | |
| | Conservative hold | Swing | | |
Red Horse
Red Horse | Party | Candidate | Votes | % | ±% |
| | Conservative | John Feilding | 698 | 61.6 | -0.8 |
| | Green | Allison Aves | 226 | 19.9 | New |
| | Liberal Democrats | John Insoll | 135 | 11.9 | +1.6 |
| | Labour | Janice Sewell | 75 | 6.6 | -2.8 |
| Majority | | | |
| Turnout | 1,153 | 42.6 | |
| | Conservative hold | Swing | | |
Shipston North
Shipston North | Party | Candidate | Votes | % | ±% |
| | Conservative | Trevor Harvey | 545 | 54.6 | +1.1 |
| | Liberal Democrats | Roger Billins | 238 | 23.8 | New |
| | Green | Peter Landsman | 133 | 13.3 | +5.7 |
| | Labour | Jan Ozimkowski | 82 | 8.2 | -17.2 |
| Majority | | | |
| Turnout | 1,017 | 33.9 | |
| | Conservative hold | Swing | | |
Shipston South
Shipston South | Party | Candidate | Votes | % | ±% |
| | Conservative | Joanna Barker | 546 | 50.9 | +14.6 |
| | Liberal Democrats | John Dinnie | 316 | 29.5 | -6.0 |
| | Green | Dvaid Passingham | 119 | 11.1 | +6.8 |
| | Labour | Frances Lee | 92 | 8.6 | -5.5 |
| Majority | | | |
| Turnout | 1,091 | 38.7 | |
| | Conservative hold | Swing | | |
Shottery
Shottery | Party | Candidate | Votes | % | ±% |
| | Liberal Democrats | David Curtis | 527 | 53.8 | +23.8 |
| | Conservative | Jake Findlater | 316 | 32.2 | -11.5 |
| | Green | Jenny Harding | 98 | 10.0 | +1.5 |
| | Labour | Robert Williams | 39 | 4.0 | -4.4 |
| Majority | | | |
| Turnout | 993 | 41.3 | |
| | Liberal Democrats gain from Conservative | Swing | | |
Snitterfield
Snitterfield | Party | Candidate | Votes | % | ±% |
| | Conservative | Peter Richards | 694 | 62.3 | -7.0 |
| | Green | Rosie Parker | 198 | 17.8 | +8.0 |
| | Liberal Democrats | Roger Harding | 162 | 14.5 | +3.8 |
| | Labour | Liam Bridge | 60 | 5.4 | -3.7 |
| Majority | | | |
| Turnout | 1,151 | 39.8 | |
| | Conservative hold | Swing | | |
Southam North
Southam North | Party | Candidate | Votes | % | ±% |
| | Independent | Tony Bromwich | 480 | 56.9 | New |
| | Conservative | Richard Hobbs | 167 | 19.8 | -31.3 |
| | Liberal Democrats | David Booth | 115 | 13.6 | +4.0 |
| | Green | Patricia Hotson | 82 | 9.7 | New |
| Majority | | | |
| Turnout | 851 | 31.1 | |
| | Independent gain from Conservative | Swing | | |
Southam South
Southam South | Party | Candidate | Votes | % | ±% |
| | Conservative | Andrew Crump | 652 | 67.8 | +10.4 |
| | Labour | Helen Wilson | 148 | 15.4 | -2.7 |
| | Green | Derek Price | 83 | 8.6 | +1.9 |
| | Liberal Democrats | Susan Roderick | 79 | 8.2 | +3.8 |
| Majority | | | |
| Turnout | 970 | 34.6 | |
| | Conservative hold | Swing | | |
Studley with Mappleborough Green
Studley with Mappleborough Green | Party | Candidate | Votes | % | ±% |
| | Liberal Democrats | Peter Hencher-Serafin | 447 | 43.7 | +4.7 |
| | Conservative | Justin Kerridge | 395 | 38.6 | -4.2 |
| | Green | Victoria Widdowson | 92 | 9.0 | +3.4 |
| | Labour | Watne Bates | 89 | 8.7 | -4.8 |
| Majority | | | |
| Turnout | 1,035 | 34.7 | |
| | Liberal Democrats gain from Conservative | Swing | | |
Studley with Sambourne
Studley with Sambourne | Party | Candidate | Votes | % | ±% |
| | Liberal Democrats | Neil Edden | 424 | 42.4 | +11.1 |
| | Conservative | Paul Beaman | 367 | 36.7 | +4.1 |
| | Green | Valerie Gaize | 105 | 10.5 | +8.3 |
| | Labour | Christopher Pilkington | 103 | 10.3 | -7.8 |
| Majority | | | |
| Turnout | 1,009 | 34.4 | |
| | Liberal Democrats gain from Conservative | Swing | | |
Tanworth-in-Arden
Tanworth-in-Arden | Party | Candidate | Votes | % | ±% |
| | Conservative | Anthony Dixon | 650 | 78.8 | +9.4 |
| | Liberal Democrats | Joseph Benjamin | 76 | 9.2 | +2.4 |
| | Green | John Stott | 72 | 8.7 | New |
| | Labour | Anthony O'Hagan | 27 | 3.3 | -15.5 |
| Majority | | | |
| Turnout | 839 | 31.9 | |
| | Conservative hold | Swing | | |
Tiddington
Tiddington | Party | Candidate | Votes | % | ±% |
| | Liberal Democrats | Catherine Rolfe | 873 | 66.8 | +18.7 |
| | Conservative | Philip Applin | 316 | 24.2 | -15.5 |
| | Green | Jack Fildew | 62 | 4.7 | ±0.0 |
| | Labour | Helen Cooper | 56 | 4.3 | -3.1 |
| Majority | | | |
| Turnout | 1,323 | 44.1 | |
| | Liberal Democrats hold | Swing | | |
Welcombe
Welcombe | Party | Candidate | Votes | % | ±% |
| | Conservative | Anthony Jefferson | 433 | 44.0 | +7.1 |
| | Liberal Democrats | Elizabeth Coles | 379 | 38.6 | +22.8 |
| | Green | Duncan Parker | 108 | 11.0 | +5.2 |
| | Labour | Sally Bigwood | 63 | 6.4 | -2.8 |
| Majority | | | |
| Turnout | 1,004 | 40.6 | |
| | Conservative hold | Swing | | |
Welford-on-Avon
Welford-on-Avon | Party | Candidate | Votes | % | ±% |
| | Independent | Frederick Barnes | 897 | 65.1 | +17.7 |
| | Conservative | Richard Cox | 291 | 21.1 | -25.8 |
| | Green | Ian Cuthbertson | 117 | 8.5 | New |
| | Labour | George Spicer | 73 | 5.3 | -0.3 |
| Majority | | | |
| Turnout | 1,384 | 44.7 | |
| | Independent hold | Swing | | |
Wellesbourne East
Wellesbourne East | Party | Candidate | Votes | % | ±% |
| | Conservative | Anne Parry | 590 | 48.5 | -0.7 |
| | Liberal Democrats | David Johnston | 391 | 32.2 | +4.5 |
| | Labour | Hazel Haywood | 105 | 8.6 | +0.9 |
| | UKIP | Frank Rietz | 70 | 5.8 | -4.1 |
| | Green | Roger Fisher | 60 | 4.9 | -0.6 |
| Majority | | | |
| Turnout | 1,228 | 41.5 | |
| | Conservative hold | Swing | | |
Wellsbourne West
Wellsbourne West | Party | Candidate | Votes | % | ±% |
| | Conservative | Daniel Kendall | 653 | 64.5 | +4.9 |
| | Liberal Democrats | Deborah Chowdhury | 151 | 14.9 | -9.4 |
| | Labour | Carol Canty | 112 | 11.1 | +1.3 |
| | Green | Victoria Parker | 97 | 9.6 | +3.4 |
| Majority | | | |
| Turnout | 1,028 | 34.3 | |
| | Conservative hold | Swing | | |
Wootton Wawen
Wootton Wawen | Party | Candidate | Votes | % | ±% |
| | Conservative | Ian Shenton | 741 | 66.8 | +11.9 |
| | Liberal Democrats | John Bicknell | 154 | 13.9 | +3.0 |
| | Green | Charlotte McClymont | 149 | 13.4 | +6.2 |
| | Labour | Philip Heath | 66 | 5.9 | -3.2 |
| Majority | | | |
| Turnout | 1,126 | 38.6 | |
| | Conservative hold | Swing | | |
Changes 2019–2023
Welford–on–Avon by-election: 12 March 2020 | Party | Candidate | Votes | % | ±% |
| | Liberal Democrats | Manuella Perteghella | 472 | 43.6 | New |
| | Conservative | Richard Cox | 323 | 29.9 | +8.8 |
| | Independent | Neal Appleton | 231 | 21.3 | -43.8 |
| | Labour | Anthony Kent | 41 | 3.8 | -1.5 |
| | Green | John Stott | 15 | 1.4 | -7.1 |
| Majority | 149 | 13.7 | |
| Turnout | 1,082 | 32.1 | -12.6 |
| | Liberal Democrats gain from Independent | Swing | | |
John Feilding, elected as a Conservative, resigned from the party in January 2023 to sit as an independent.[2]
Jason Fojtik, elected as an independent in May 2019, rejoined the Labour party (which he had left shortly before the 2019 election) in March 2023.[3]
References
- ^ Dalby, David (13 May 2019). "DECLARATION OF RESULT OF POLL" (PDF). Stratford-on-Avon District Council. Archived (PDF) from the original on 14 November 2021.
- ^ Boothroyd, David (6 January 2023). "No arguments - Dunmow goes Tory". Local Councils. Thorncliffe. Retrieved 22 January 2024.
- ^ Boothroyd, David (24 March 2023). "Tory hold in a rush in Northants". Local Councils. Thorncliffe. Retrieved 22 January 2024.


 11
11  8
8 

 Council elections in Warwickshire


